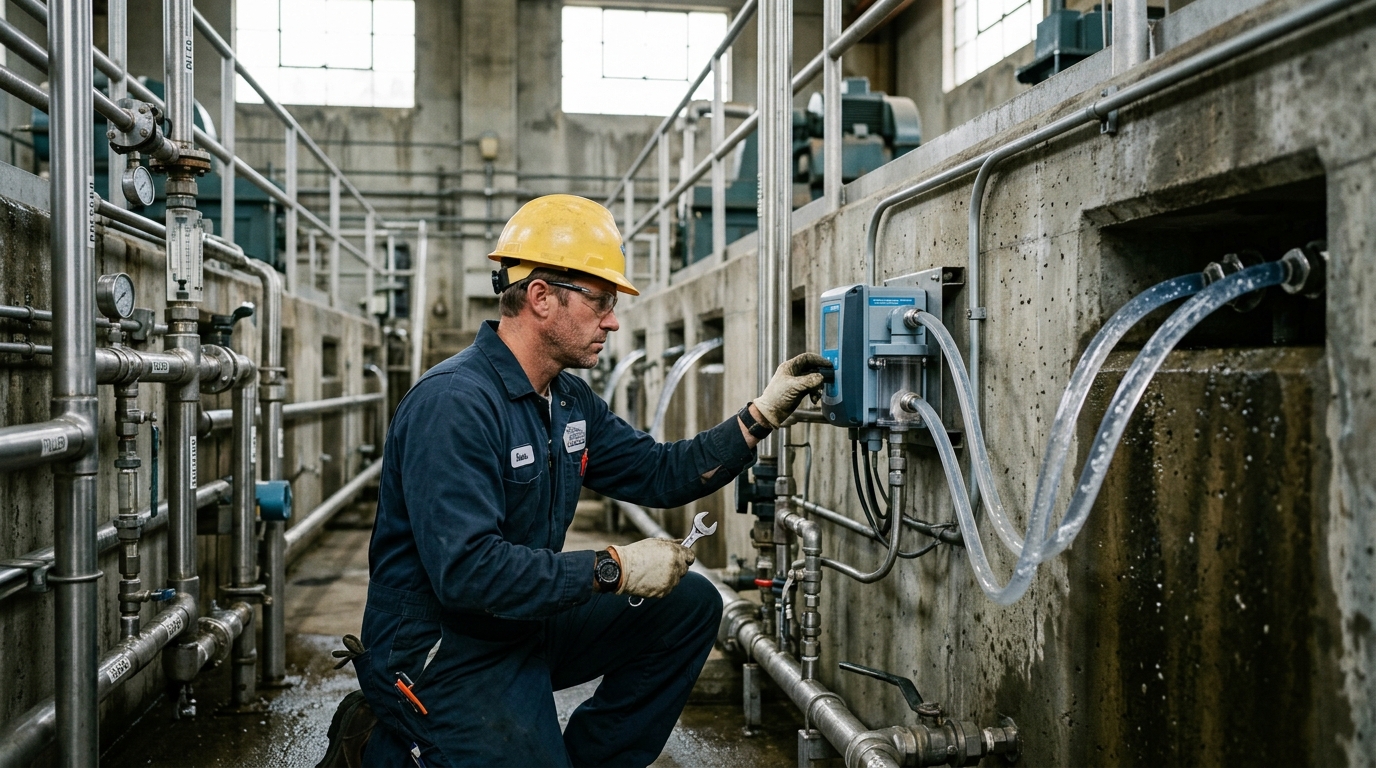
Flow-Through Turbidity Meter Solution for Filter Backwash Monitoring in Water Treatment Plants
Addressing the pain points of experience-based backwash scheduling in sand filters, laboratory grab sampling that misses turbidity breakthrough inflections, and the twin risks of effluent non-compliance and backwash water waste, this solution deploys flow-through turbidity meters as the core sensing element. With laser 90° scattering optics, 0.001 NTU resolution and ±2% accuracy, filtered water turbidity is monitored continuously filter-by-filter, and RTU/PLC linkage triggers backwash automatically on threshold breach — delivering data-driven filter operation, precise backwash timing and stable compliant plant effluent.
Overview
Summary
Addressing the pain points of experience-based backwash scheduling in sand filters, laboratory grab sampling that misses turbidity breakthrough inflections, and the twin risks of effluent non-compliance and backwash water waste, this solution deploys flow-through turbidity meters as the core sensing element. With laser 90° scattering optics, 0.001 NTU resolution and ±2% accuracy, filtered water turbidity is monitored continuously filter-by-filter, and RTU/PLC linkage triggers backwash automatically on threshold breach — delivering data-driven filter operation, precise backwash timing and stable compliant plant effluent.
Key Advantages
Challenges
- Experience-based backwash timing: fixed-cycle or head-loss-threshold scheduling cannot perceive the real turbidity breakthrough progression of filtrate; premature backwash wastes 3–5% of plant water and energy, while late backwash lets effluent turbidity exceed limits and threatens supply safety
- Insufficient temporal resolution of grab sampling: offline laboratory tests every 1–2 hours miss the turbidity inflection point; breakthrough events occurring between samples go completely undetected, and backwash decisions lack continuous data support
- High cost of per-filter online monitoring: conventional benchtop turbidity analyzers are bulky, single-channel and expensive; equipping dozens of filter cells strains capital budget and workshop space, with no compact wall-mount or multi-instrument networking options
- Optical measurement drift from interference: micro-bubbles, biofilm and iron/manganese deposits in filtrate foul the optical window; without constant-flow sampling and de-bubbling design, readings drift and cause false or missed alarms, exhausting operators with cleaning and verification
- Broken operational data chain: turbidity data never reaches SCADA, so filter performance KPIs — initial turbidity, run length, backwash water ratio — cannot be quantified, and media replacement and process optimization remain judgment calls
Results
- 7×24 continuous online turbidity monitoring of every filter cell effluent; 0.001 NTU resolution captures the breakthrough inflection precisely, backwash fires on time, filtrate turbidity holds steadily below 0.1 NTU and finished-water compliance improves markedly
- Backwash decisions shift from experience-driven to data-driven: invalid backwashes drop, backwash water ratio decreases, filter runs lengthen, and water/energy consumption per unit of production falls accordingly
- Compact wall-mount instruments deployed per filter plus RTU networking bring the full turbidity data stream into SCADA; filter status is visualized on the control-room wall, sharply reducing patrol and manual logging workload
- Threshold alarms interlocked with backwash close the water-quality risk loop: breakthrough events are handled automatically and fully logged, eliminating compliance incidents and audit disputes
- Continuous operating data enables quantitative filter performance assessment (initial turbidity, run length, backwash water ratio), providing the evidence base for media grading adjustments, replacement cycles and whole-process optimization
Solution Details
Why Continuous Filtrate Turbidity Monitoring Matters for Filter Backwash Control
Filtration is the last physical barrier protecting finished-water turbidity compliance in a water treatment plant. As a sand filter run progresses, retained solids accumulate and the filtrate turbidity rises sharply at the end of the cycle — the turbidity breakthrough phenomenon. Conventionally, plants schedule backwash by fixed cycles or head-loss rules of thumb: backwashing too early wastes 3–5% of production water and energy before the filter's solids capacity is used up, while backwashing too late allows breakthrough to push effluent turbidity out of compliance and threaten drinking-water safety. Laboratory grab samples taken every 1–2 hours lack the temporal resolution to catch the turbidity inflection, leaving backwash decisions without continuous data support.
This flow-through turbidity meter solution uses flow-through turbidity meters based on the laser 90° scattering principle (aligned with ISO 7027 and GB/T 13200 standard methods). Sample water flows continuously through the optical measuring cell at a constant 50–300 ml/min, with 0.001 NTU resolution and ±2% or ±0.015 NTU accuracy, identifying subtle filtrate turbidity rises at the 0.05–0.1 NTU level before full breakthrough. One compact wall-mount instrument is deployed on each filter cell's effluent branch, with upstream strainers and de-bubbling sampling accessories resisting biofilm and bubble interference. Threshold alarms and 4–20 mA / RS485 outputs are integrated via RTU/PLC into the plant SCADA, triggering cell-by-cell automatic backwash on breakthrough signals while accumulating run-length, initial turbidity and backwash-water-ratio KPIs for media maintenance and process optimization.
Key Performance Data of the Flow-Through Turbidity Meter
0.001 NTU
Resolution
±2% or ±0.015 NTU
Indication Error
50–300 ml/min
Flow-Through Sampling Rate
30 s – 2 min
Response Time
≤ ±0.015 NTU
Zero Drift
≤ 1%
Repeatability Error
Product Features: Laser Turbidity Measurement for Filter Backwash Monitoring
- Laser 90° scattering measurement: compliant with ISO 7027 and GB/T 13200 standard methods; 0.001 NTU resolution identifies subtle filtrate turbidity rises at the 0.05–0.1 NTU level for early breakthrough warning
- Flow-through constant-flow sampling: sample flows continuously through the measuring cell at 50–300 ml/min with no stagnant dead volume; response time 30 s – 2 min tracks filter condition changes in real time
- High accuracy and stability: indication error ±2% or ±0.015 NTU (whichever is greater, Formazin primary standard), zero drift ≤ ±0.015 NTU, repeatability error ≤ 1%
- Three selectable ranges: 0–1 NTU, 0–20 NTU and 0–100 NTU cover strict direct-filtration control, conventional filter monitoring and high-turbidity raw-water seasons
- Alarm outputs and multi-interface networking: threshold-exceedance alarm with 4–20 mA analog and RS485 digital interfaces, integrating seamlessly with PLC, RTU and SCADA for automatic backwash interlock
- Compact wall-mount industrial design: IP54 protection, DC24V supply, only 4.5 kg and 183×349×113.5 mm footprint for dense deployment in filter galleries and instrument rooms
Technical Specifications of the Flow-Through Turbidity Meter
- Measurement Principle: Laser 90° scattering, compliant with ISO 7027 and GB/T 13200
- Resolution: 0.001 NTU
- Accuracy / Indication Error: ±2% or ±0.015 NTU (whichever is greater, Formazin primary standard)
- Zero Drift: ≤ ±0.015 NTU
- Repeatability Error: ≤ 1%
- Sample Flow Rate: 50–300 ml/min continuous flow-through
- Response Time: 30 s – 2 min
- Selectable Ranges: 0–1 NTU, 0–20 NTU, 0–100 NTU
- Outputs: Threshold-exceedance alarm, 4–20 mA analog, RS485 digital
- Integration: PLC, RTU and SCADA compatible for automatic backwash interlock
- Protection Rating: IP54
- Power Supply: DC24V
- Weight: 4.5 kg
- Dimensions: 183×349×113.5 mm
- Mounting: Compact wall-mount industrial design
Application Scenarios for Filter Backwash Turbidity Monitoring
This flow-through turbidity meter solution is designed for continuous filtrate turbidity monitoring on each filter cell's effluent branch in water treatment plants. Upstream strainers and de-bubbling sampling accessories resist biofilm and bubble interference, ensuring reliable measurement in filter galleries and instrument rooms. Threshold alarms and 4–20 mA / RS485 outputs are integrated via RTU/PLC into the plant SCADA, triggering cell-by-cell automatic backwash on breakthrough signals while accumulating run-length, initial turbidity and backwash-water-ratio KPIs for media maintenance and process optimization.
? References
- ISO 7027 — Water quality: Determination of turbidity
- GB/T 13200 — Water quality: Determination of turbidity
Approach
How we implement intelligence into your infrastructure step by step.
Process survey and measurement-point planning
Map filter types (V-filter, siphon filter, membrane), cell count and effluent piping layout; assign one measurement point per filter cell plus a combined-effluent checkpoint, define sampling locations, drainage routes and power supply, and produce the point schedule.
Instrument selection and sampling configuration
Select the 0–1 NTU or 0–20 NTU range per the filtrate turbidity control target (≤0.1 or ≤0.3 NTU); configure constant-flow sampling valves, upstream strainers and de-bubbling accessories, and fix wall-mount positions with sample/drain tubing routes (6 mm inlet, 10 mm outlet and drain).
Installation, calibration and data verification
Install instruments per wall-mount specifications, adjust inflow to the stable 50–300 ml/min window, complete zero/span calibration with Formazin standards, cross-check against parallel laboratory analyses, eliminate optical-path bubbles and tubing leaks, and confirm deviation within tolerance.
Backwash interlock and platform networking
Set turbidity alarm thresholds with duration criteria (e.g. >0.15 NTU for 10 continuous minutes); trigger single-filter backwash via RTU/PLC or raise an alarm for operator confirmation; feed 4–20 mA / RS485 signals into SCADA and configure filter operation displays, turbidity trend curves and backwash log reports.
O&M regime and performance evaluation
Establish schedules for optical-window inspection and cleaning, periodic standard-solution verification and consumable replacement; aggregate monthly KPIs — initial turbidity, run length, backwash water ratio — to quantify filter performance and continuously refine backwash trigger strategy and media maintenance cycles.
Recommended Hardware
Essential components for this solution.
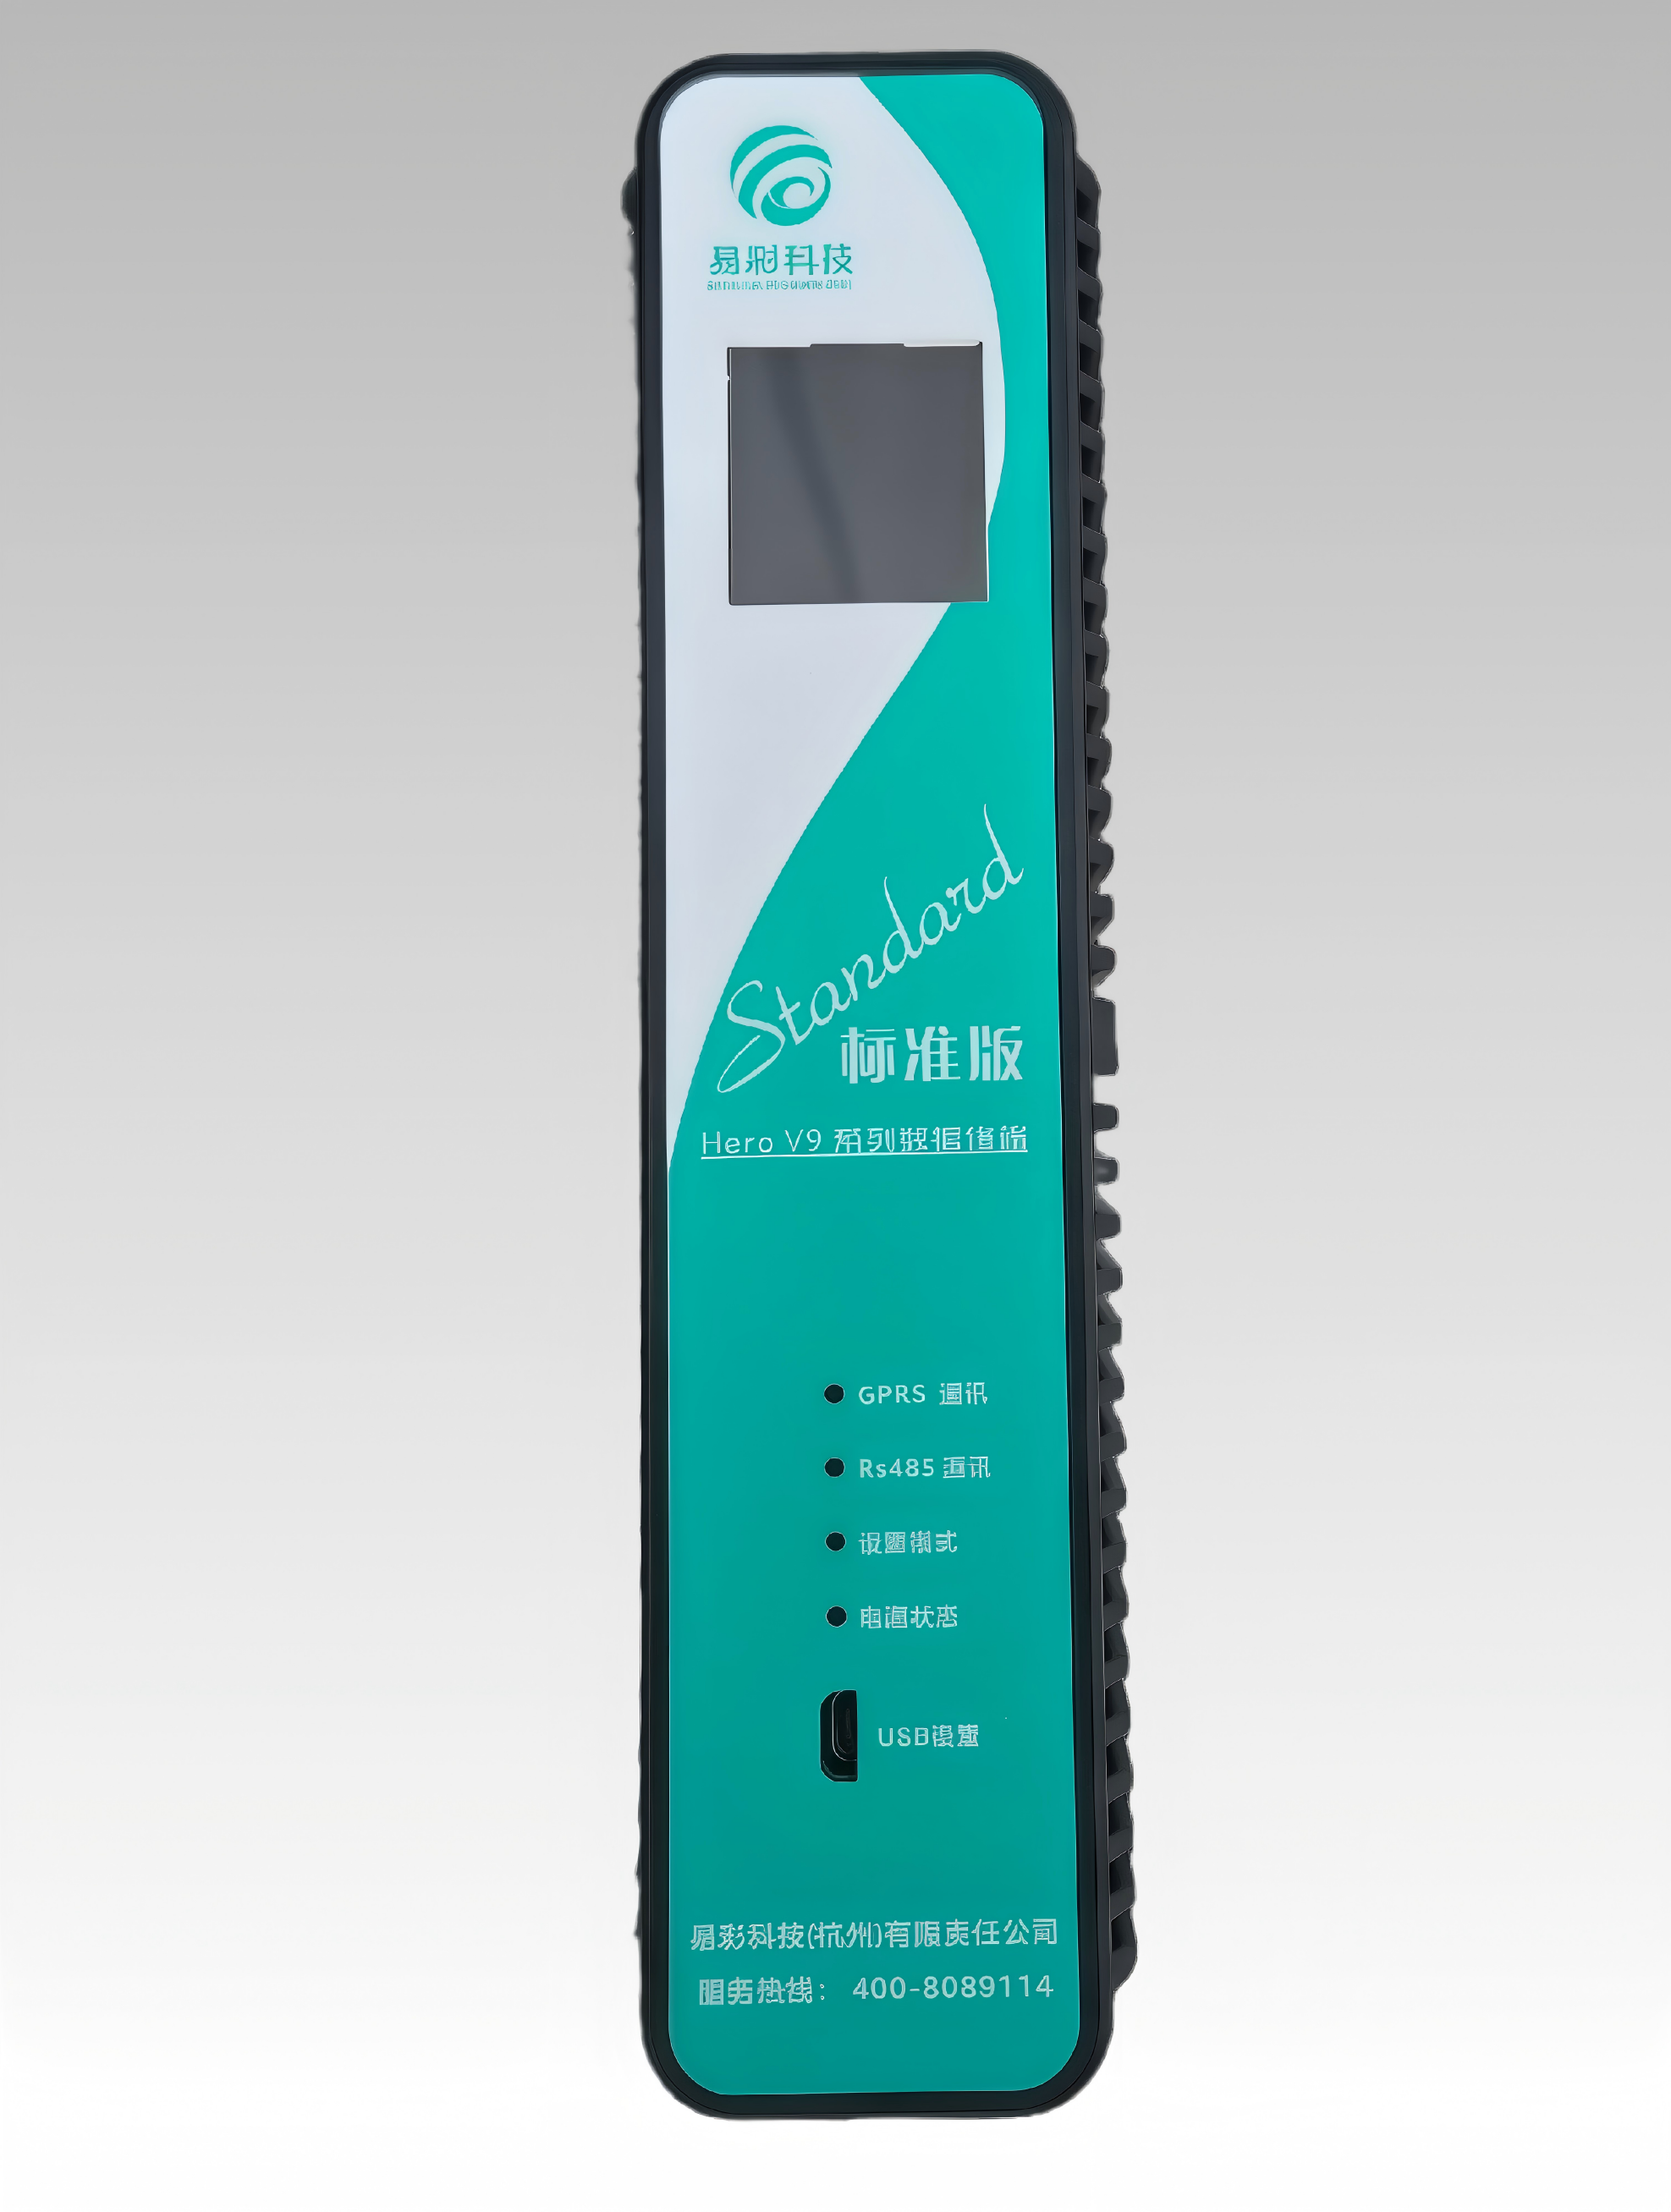
HERO V9-EC32 Hydrology RTU | Remote Terminal Unit
This product has the functions of remote data collection, control and communication. It can receive ...
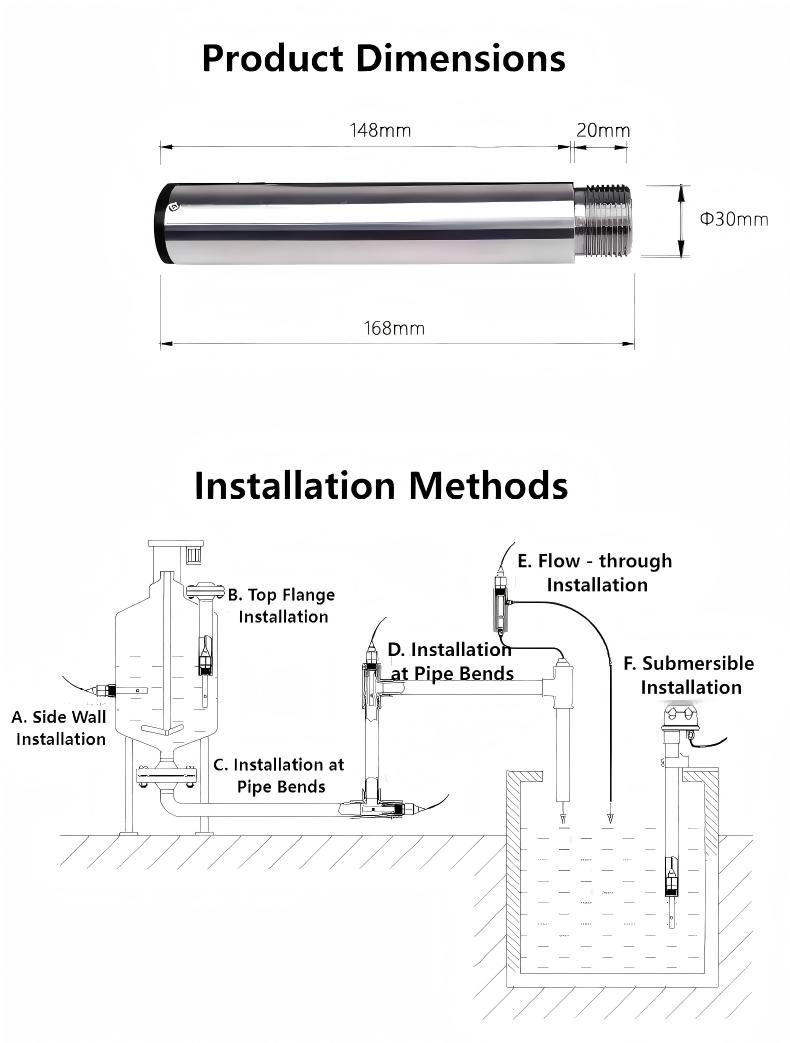
Submersible Turbidity Sensor Electrode
This product is widely used for online turbidity monitoring in water treatment plants (e.g., inlet, ...
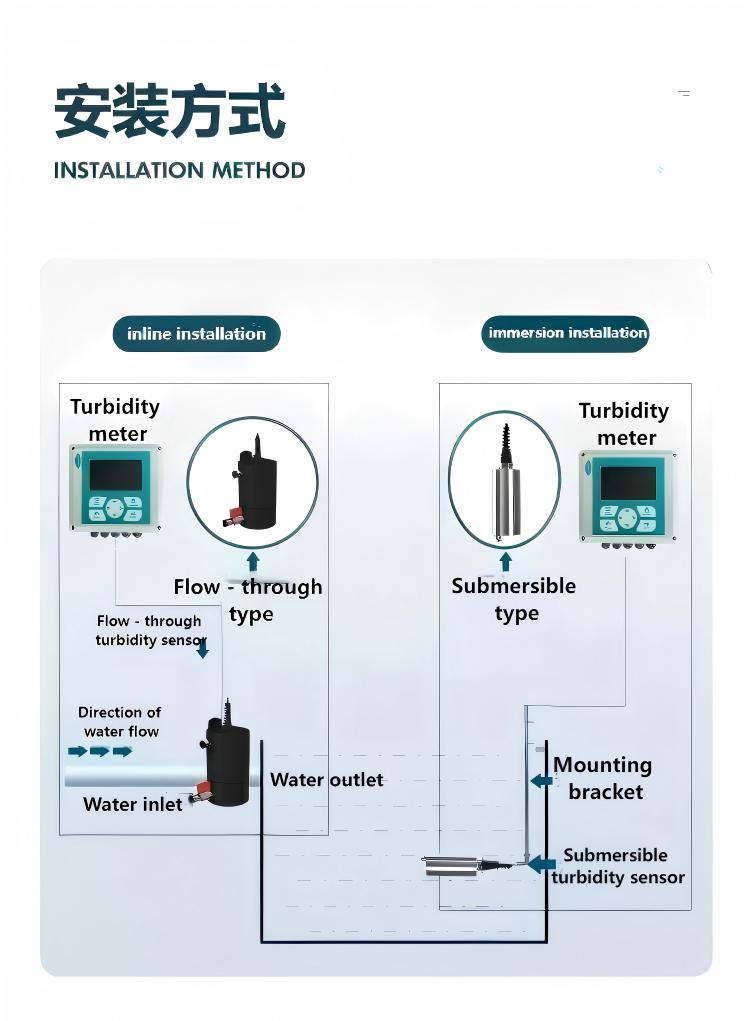
Flow-Through Turbidity Meter
The Flow-Through Turbidity Meter is an intelligent online chemical analyzer widely used in industrie...
❓ Related FAQs
Related Solutions
Submersible Turbidity Electrode Solution for Sedimentation Tank Effluent and Filter Run Turbidity Monitoring
Sludge Concentration Meter Solution for RAS and WAS Control in Wastewater Treatment Plants
Multi-Electrode Conductivity Meter Solution for Coastal Groundwater Saltwater Intrusion Monitoring and Early Warning

Ready to Optimize Your Business?
Contact us, and our professional team will provide customized solutions to help your business achieve digital transformation.
Get In Touch