How a Water Utility Group Achieves Cost Reduction and Efficiency Gains Through Doppler Flow Meters
Engineering Application of Non-Contact Doppler Flow Meters in Flow Monitoring of the East City Drainage River
In September 2024, the flow monitoring project for the East City drainage river in a certain city completed acceptance and entered the stable operation phase. To address the needs of flood-season dispatch, dry-season ecological flow management, and evidence collection for suspected discharge behavior, the project deployed an online monitoring system integrating a non-contact Doppler velocity radar, a millimeter-wave radar level gauge, an integrated camera, and an edge computing gateway.
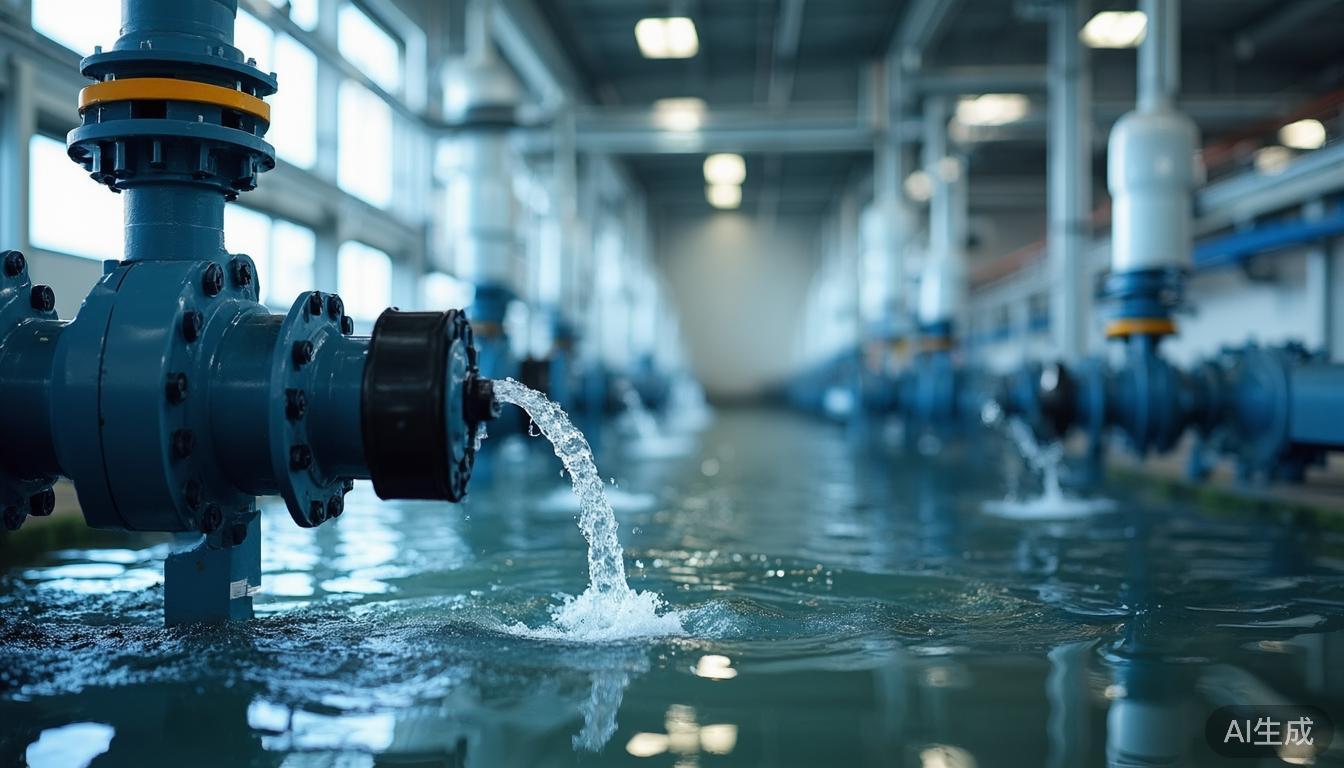
The monitoring cross-section was located in the middle reach of the East City Drainage River, with a river width of about 12.4 m. Design normal water levels ranged from 0.8 m to 1.6 m, with a highest flood-season level of 2.4 m and a lowest dry-season level of 0.25 m. System data showed that within a velocity range of 0.15 m/s to 3.2 m/s and a flow range of 0.06 m³/s to 16.8 m³/s, the system maintained continuous acquisition. The data completeness rate reached 99.6%, and the average relative flow measurement error was controlled at around 5%, providing a traceable data foundation for pump station dispatch, waterlogging warning, and drainage supervision.
1. Project Background: Shift from Manual Measurement to Continuous Online Monitoring
The East City area is a critical part of the old urban drainage system, covering a basin area of ~18.6 km² and a drainage river length of ~3.2 km. Previously, flow data relied heavily on manual measurements conducted three times per week (daily during floods). Each measurement required two operators, cup-type current meters, and sounding rods. Affected by weather and safety, a single measurement took ~90 minutes, with reporting taking 6–12 hours.
Existing contact Doppler meters faced limitations in open channels due to sediment, debris, algae, and oil contamination adhering to sensors, causing signal attenuation. Traditional instruments required cleaning and calibration 2–3 times per month during rainy seasons, costing CNY 800–1,500 per instance. Consequently, the project owner mandated a non-contact solution capable of simultaneously providing velocity, water level, flow, cross-section status, and camera recording.
2. Technical Challenges: Low Velocity and Complex Conditions
- Low-Velocity Measurement: During ecological replenishment, velocities often dropped below 0.35 m/s, approaching 0.15 m/s. Doppler radars struggle here as echo frequency shifts are small and easily disturbed by raindrops and surface fluctuations. Early trials showed velocity jumps up to 2.0 m/s when actual surface velocity was only ~0.6 m/s during heavy rain.
- Irregular Cross-Sections: Sediment deposition (0.15–0.30 m thick) altered riverbed elevation. Using design cross-sections alone resulted in flow errors exceeding 20% at low water levels. Vegetation and duckweed also affected radar echoes and video analysis.
- Power & Communication Constraints: The site was 1.2 km from the nearest power source. Laying cables would have increased construction time by >25 days and introduced maintenance risks, necessitating a self-sufficient power solution.
3. Overall Solution: Multi-Sensor Fusion Architecture
The project adopted a "non-contact Doppler velocity radar + 80 GHz radar level gauge + integrated camera + edge computing gateway" configuration installed on lateral gantries and bridge brackets.
Doppler Velocity Radar
24 GHz band, range 0.1–15 m/s, accuracy ±0.02 m/s or ±1%. Installed at 2.8 m height with a 45° beam incidence angle.
Radar Level Gauge
80 GHz FMCW technology, range 0.3–30 m, accuracy ±3 mm. Used for real-time water surface elevation and wetted area calculation.
Integrated Camera
1920×1080 resolution, 25 fps, with infrared fill light and WDR. Records surface conditions, debris, and nighttime scenes.
Edge Computing Gateway
Handles data filtering, outlier removal, flow calculation, and image capture. Sampling at 1/min, uploading every 5 min.
Flow Calculation Model: Instantaneous Flow = Wetted Area (from Level Gauge) × Average Velocity (Surface Velocity × Dynamic Coefficient).
Surface velocity coefficients were dynamically corrected based on water level intervals and morphology, ranging from 0.92–0.96 (normal levels) to 0.94–0.98 (flood season).
4. Cross-Section Surveying and Calibration
High-precision surveying using total stations and UAV oblique photography established accurate water level–area curves. For low water levels (<0.3 m), measured sedimented cross-sections replaced design bottoms to avoid overestimating wetted area. For high levels (>2.0 m), a segmented area integration model accounted for floodplain overflow and bridge pier obstruction.
Thirty-six sets of manual comparison tests using ADCP and current meters validated the velocity coefficients. Results indicated that dense duckweed reduced radar echo intensity by ~35%, prompting the introduction of image quality scores into the data validity judgment algorithm.
5. Integrated Camera and Evidence Chain Creation
The camera served as a critical auxiliary module for verification. It captured images every 5 minutes and triggered event-based captures during anomalies. If the deviation between Doppler radar readings and video-estimated velocity exceeded 0.15 m/s three times consecutively, the system marked data for review.
During trial operations, the system detected abnormal color bands on the upstream water surface between 2:00–4:00 AM without rainfall response. Field inspectors confirmed a nighttime discharge anomaly using the retained evidence chain (timestamps, water level, velocity, flow, and images), demonstrating superior supervisory value compared to single flow curves.
6. Implementation Process and Power Solutions
The project cycle spanned 45 days: 7 days for survey/design, 12 days for construction, 2 days for installation, 5 days for commissioning, and 30 days for trial operation. A hot-dip galvanized steel bracket with C30 concrete foundation ensured wind resistance up to Grade 12.
Solar Power System
Utilized 60W monocrystalline silicon panels and a 100Ah lithium iron phosphate battery. Designed for 7-day autonomy under overcast/rainy conditions. Full-load consumption was ~18W, averaging ~9W. This eliminated the need for costly cable laying and associated construction delays.
During initial rainfall tests, raindrop interference caused velocity overestimation (~0.08 m/s). Adding a radar rain cover, extending signal averaging time to 30s, and enabling noise recognition algorithms reduced this deviation to within 0.03 m/s.
7. Final Results: Accuracy, Efficiency, and Supervision
Operational Efficiency: Manual flow measurement frequency dropped from 3x/week to 1x/month (for validation only). Single field operation duration decreased from 90 mins to 25 mins. Annual O&M costs fell from ~CNY 180,000 to ~CNY 96,000.
Flood Dispatch: The system issued waterlogging warnings ~35 minutes earlier than traditional methods. During a heavy rain event, it predicted rapid water level rise (0.38 m in 25 mins), allowing proactive pump adjustment that reduced peak water depth by 0.12 m.
Supervision: 17 effective warnings were triggered during trial operation, including 3 suspected abnormal discharges, 2 debris accumulations, and 12 process records.
8. Experience Summary and Outlook
This case demonstrates that non-contact Doppler flow meters offer clear advantages in open-channel scenarios by eliminating sensor fouling issues. However, success requires more than just hardware replacement; it demands precise cross-section surveying, field calibration, and multi-source data fusion.
Future developments may include dual-frequency Doppler arrays, higher-precision radar levels, starlight-level cameras, and edge AI for pollutant diffusion estimation. As urban drainage monitoring shifts from "having data" to "trustworthy, traceable processes," this project provides a replicable engineering sample for smart water management, combining non-contact measurement with integrated visual evidence for robust supervision and operational efficiency.